Skip to content

Monitoring and Impact Assessment of the Clean Energy Transition Monitoring

Home / Monitoring

Are you ready to go beyond traditional metrics and capture the full impact of your community’s clean energy transition?

PLENTY-Life’s monitoring and impact assessment framework goes beyond traditional KPIs  by tracking progress along defined transformation pathways towards climate-neutrality. The framework supports evidence-based decision-making by assessing socio-economic and environmental impact of the developed clean energy transition strategies. It also helps cities to prioritise actions by sector and measure in light of expected technical and financial challenges across key domains such as building, transport and community infrastructure.

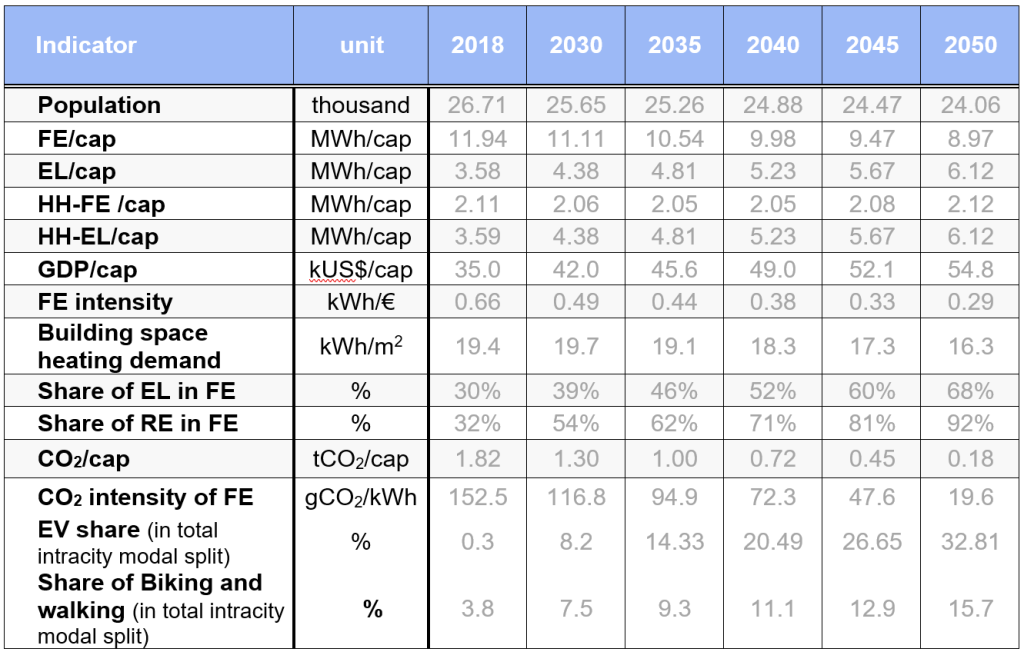
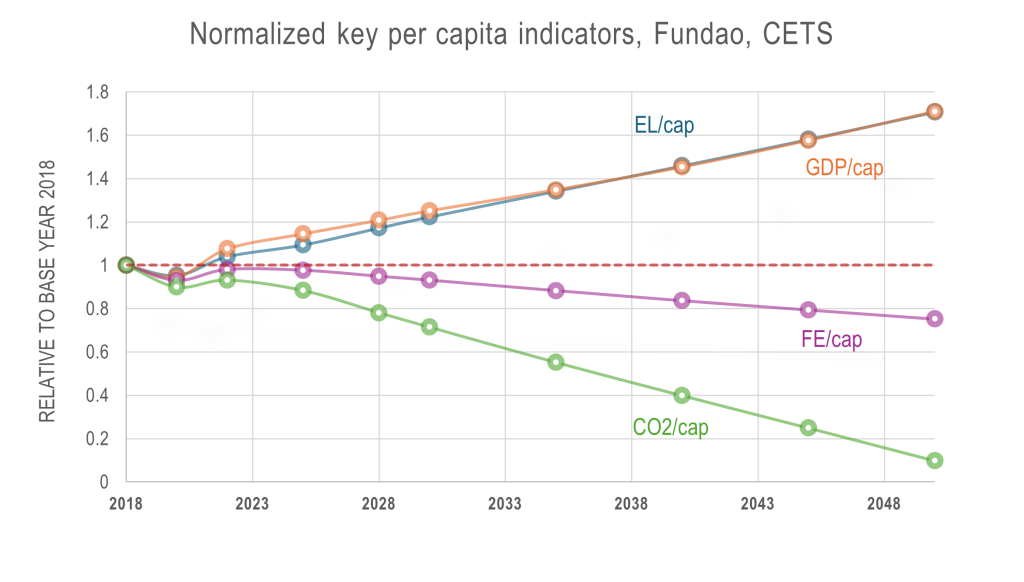
The monitoring framework is based on a set of key indicators derived from scenario modelling results and the principal assumptions validated through the stakeholder co-creation process. These indicators track the trajectory of the clean energy transition towards a sustainable and carbon-neutral urban energy system.

Aligned with the SDGs goals 7, 11, and 13, the framework assesses energy savings across sectors, the increasing share of renewable energy in final demand, and the evolution of CO₂ emissions. Additional indicators capture socio-economic dimensions, including GDP-based energy and emission intensities, demand elasticity, and per-capita values.

Together, these indicators support municipal decision-making by highlighting the impacts of decarbonisation measures and informing the prioritisation of actions across key sectors such as buildings and mobility (e.g. building refurbishment, electrification of end-uses, expansion of public transport, electric mobility, and active transport).

Pilot cities will apply the framework to track progress and periodically update their strategies within 5–10-year cycles. At the same time, the approach provides a practical reference for follower cities when developing their own Clean Energy Transition strategies, while adapting the lessons learned from pilot cases to their local socio-economic, technical, and climatic conditions.

A holistic approach to monitoring clean energy transition

The formulated clean energy transition strategies are assessed and monitored using a set of selected KPIs defined in the PLENTY-Life monitoring framework (KICET: Key Indicators for Clean Energy Transition). These indicators are further aligned with the UN-SDGs 7,11 and 13, as well as with SECAP framework, ensuring coherence with international and local climate and energy targets.

The KICET are designed to track progress toward the envisaged energy and climate goals of the SMCT, facilitate communication of sustainability goals with key stakeholders, and enable evidence-based impact analysis of proposed future measures. Based on these insights and analyses, a prioritized set of high impact actions is derived to guide cities in implementing effective and efficient clean energy transition measures.

Key Indicators of clean energy transition (KICET)

The set of KICET includes, besides the sectoral annual/spatial development, indicators of sustainable such as per capita values, intensities and elasticities of GHG-emission, final energy demand including shares of clean energy and electricity, and shares of local renewables and energy import.

Particular attention is paid to monitoring the impact of the employed decarbonization measures, including energy efficiency by sector with spatial dimension, the contribution of onsite and local renewable energy to final demand, fuel switching to clean alternatives, and electrification.

A set of the most common Key indicators of the CET (KICET), to monitor the impact of implemented measures (for the study period), is shown in Table 1. An example of the effect of the sustainable development pathway of the CETS on the normalized KPIs (GDP per capita, electricity demand per capita, final energy demand per capita and CO2 emission per capita) is shown in Figure 1.

Table 1: Key indicators of the CET scenario in the municipality of Fundão.

(FE: Final energy demand, EL: electricity demand, HH: household, SH: space heating, SS: Service sector; RE: Renewable energy systems; GDP: Gross domestic product).

Figure 1: Normalized KPIs (per capita) in the CETS of the municipality of Fundão. Despite the strong increase of GDP per capita and the expected energy consumption, the final energy demand per capita decreases mainly due to energy efficiency measures in all sectors, the increasing electrification of end-use categories, and the increased switch to renewable energy sources. As a result of these measures, CO2 per capita also decreases, which is a proof of the sustainable pathway of the CETS.